Debugging stubborn DynamoDB Queries A Quick guide for Java and Node
Work in Progress. Stay tuned! ⏳
DynamoDB (DDB) is the most impressive Data Store I've ever worked with. DDB is the de facto general-purpose database here at Amazon, and you would only consider something else if you have particular needs.

What's so remarkable about it? It loves scale! It has a simple API that drives your data modeling decisions, forcing you to build simple queries that perform well no matter how much data is stored in your tables or how many clients are querying it at the same time.
I've worked with it on Java, Node, and Go, and it is consistently performant. It's blazing fast. When calling from the same region, getting an item from DynamoDB (DDB) takes under 30ms for Node client and 10ms for Java and Go clients. That's pretty impressive!
The one thing that I don't enjoy is working with its SDK. It's improving for both Java and Node with the Enhanced DDB Client and the stand-alone DDB Client v3 for JavaScript, but they are still tricky, and the documentation is somewhat scarce.
The Developer Experience leaves a lot on the table. You have to figure it out on your own. Here are the docs for a Query on the JavaScript SDK. It's pretty much type hinting information mixed with high-level DynamoDB concepts.
Whenever I'm stuck with a where I can't explain what's happening, I follow a two-step strategy to unblock myself:
- First, I look at the traces to confirm that XRay sees the problem too. This quick step helps you determine if the issue is inside your service or is coming from DynamoDB.
- Then, I check the logs for the request and response from the DDB client to see that I'm doing the right thing.
Slow Requests
These are some common things that make a DDB request slow:
- The item size is too big. DynamoDB will automatically create more than one request in the backend if the item is large to break it into pieces and fetch the data.
- The Query is fetching too many items. In this scenario, the client and the backend can make more than one request to fetch the data. Some clients can eagerly ask for more than one page when running a query (or a scan , but one never scans). This can be counter-intuitive because the docs state these operations are "on-demand".
- Cross-regional calls. If the service runs in us-west-2 and the table is on us-east-1, there's a ~200ms penalty on each request. This seems obvious, but I've been bitten more than once by it. It's hard to tell unless you're specifically looking for that.
- The client is not maintaining a connection pool. Very common on Lambda with cold starts, but it happens on provisioned instances right after deploying.
Looking on X-Ray
A Quick intro to XRay
AWS XRay is part of AWS's observability stack. It is robust and works with most AWS clients and services out of the box. Traces or Segments represent an activity or service call from your code.
There are two observability areas in the AWS Console. One is the AWS XRay service (the old console), and the other is in AWS CloudWatch's Service Map (the newer one). In general, they share the same features. The old one will be deprecated in the future.
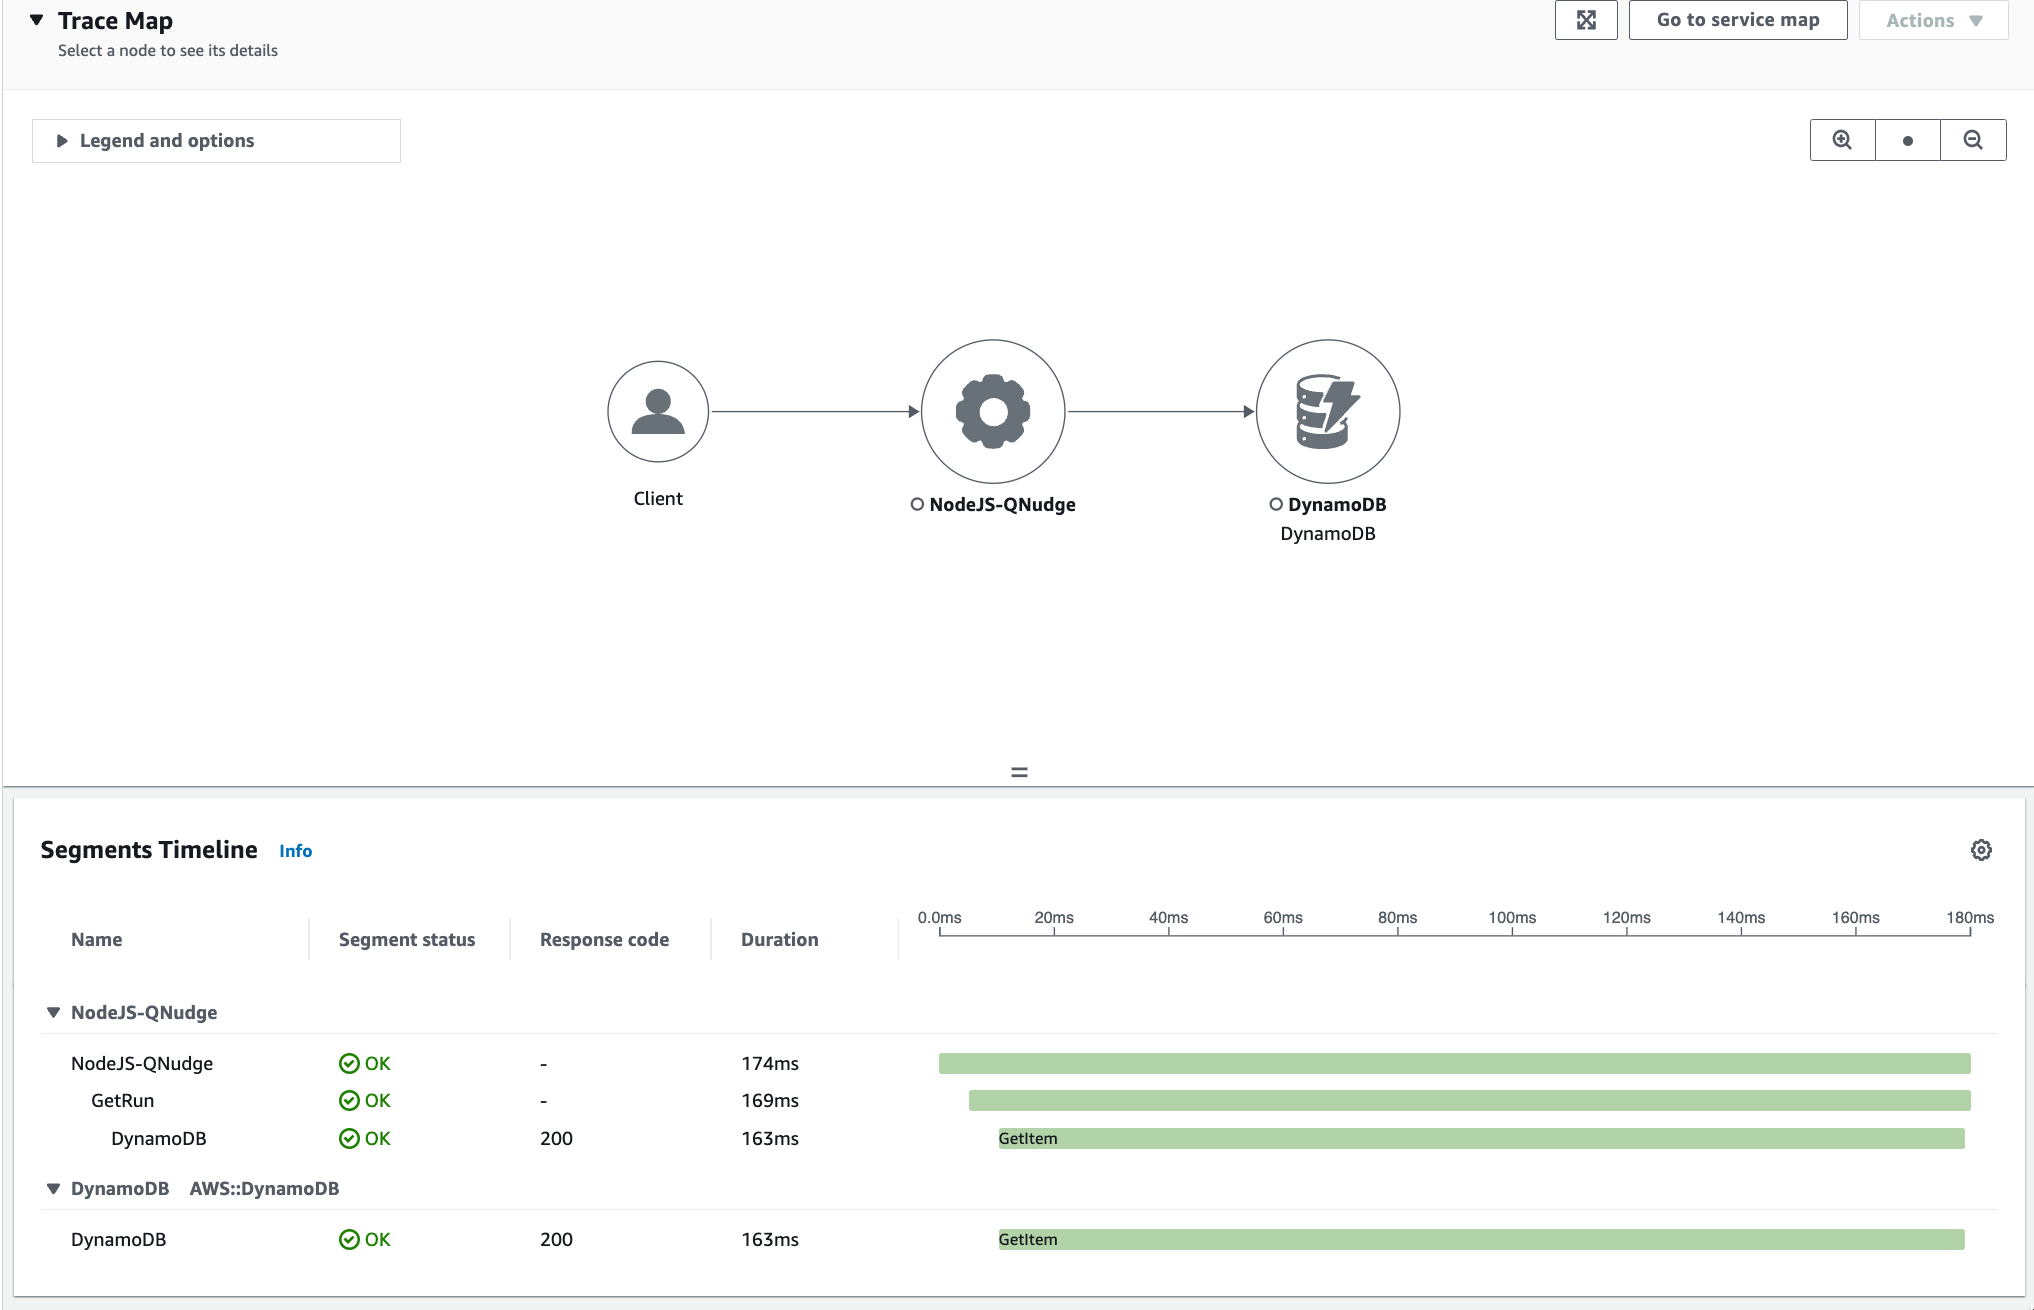
This is what a typical trace looks like in CloudWatch's Service Map:
 Segment (NodeJS) in CloudWatch — DB GetItem took 163ms.
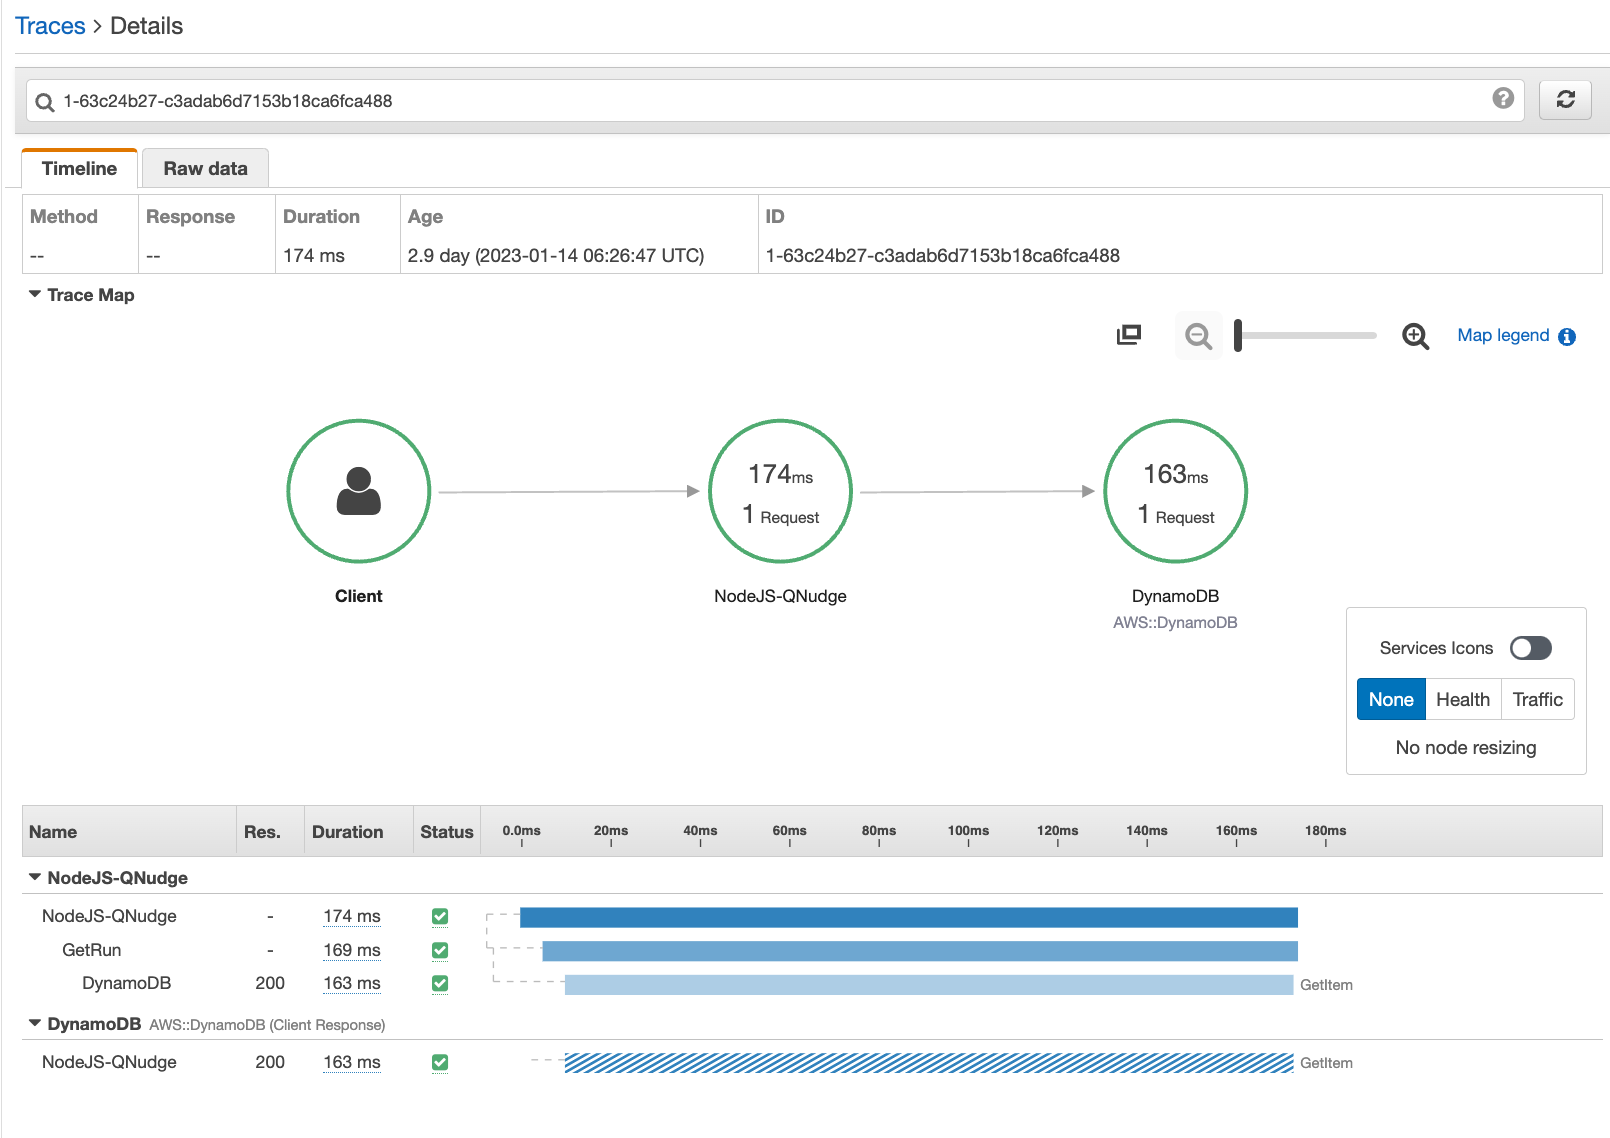
Here's the same trace in the XRay Console:
 Segment (NodeJS) in XRay — DB GetItem took 163ms.
In order to capture these traces, the service needs to be instrumented. The XRay SDK provides methods and utilities to instrument a service. It can "wrap", most AWS clients and HTTP clients, and all requests with these clients are instrumented automatically. But service-specific operations need to be instrumented manually.
Here is the code that instruments the DynamoDB client, and here is the code that captures the "service call".
It can be tedious to jump from one console to the other. But, the trace id is always the same in both consoles. Using the id makes it easy to switch between them. Here's an example for trace id 1-63c24b27-c3adab6d7153b18ca6fca488 with examples for both consoles:
Cloud Watch Service Map link looks like this:
https://us-west-2.console.aws.amazon.com/cloudwatch/home?region=us-west-2#xray:traces/1-63c24b27-c3adab6d7153b18ca6fca488The XRay link for the same trace looks like this:
https://us-west-2.console.aws.amazon.com/xray/home?region=us-west-2#/traces/1-63c24b27-c3adab6d7153b18ca6fca488-030dc84e378fd9dc
Request Metadata
Metadata about all AWS SDK requests is stored in the XRay traces. The DynamoDB segment includes information like the type of request (GetItem, Query, Scan, etc.), validation and error information, the number of retries, the region where the table is hosted, the duration of the request and the size of the response.
 DDB Segment Details - Resource Information.
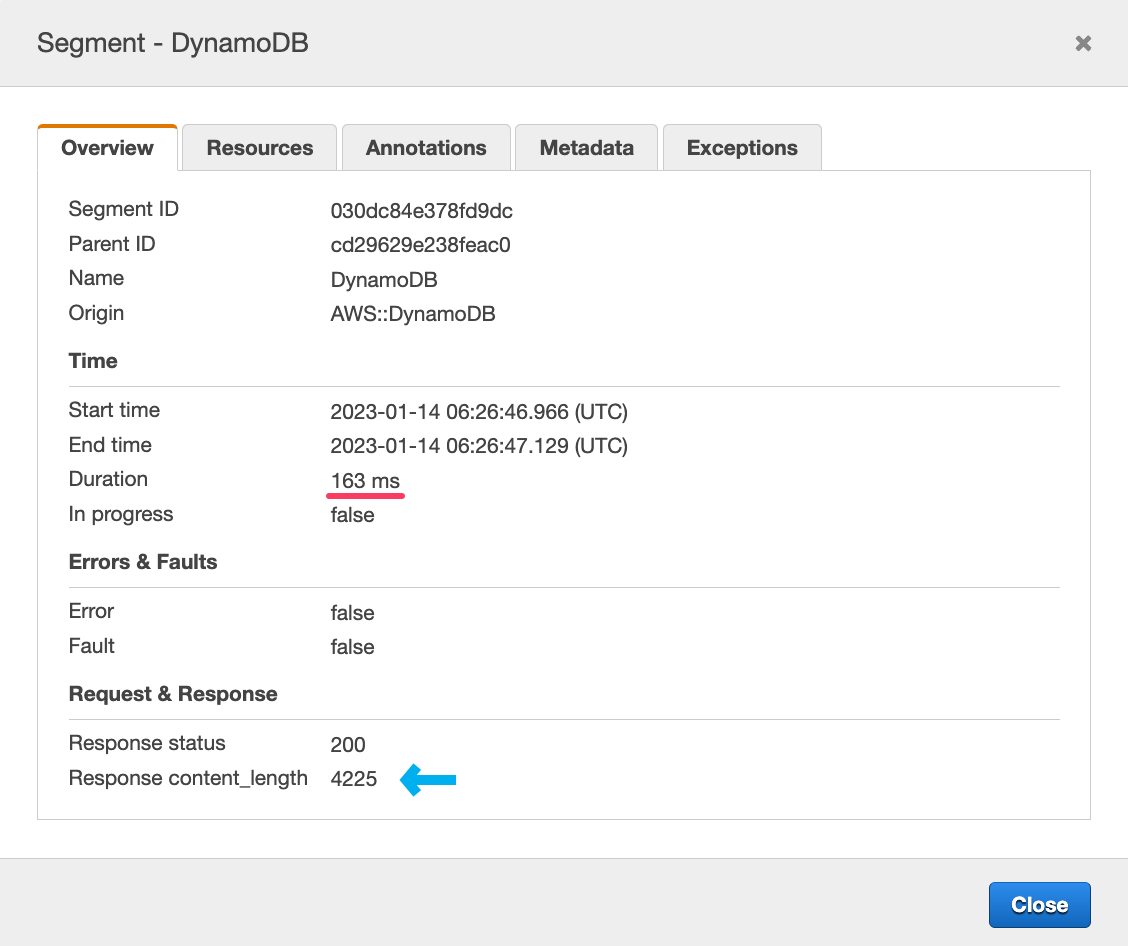
 DDB Segment Details - Overview (Old XRay console)
From the information above we can narrow down the issues pretty quickly:
This is a GetItem request, so it's only one item (not B). The table is running on us-west-2, which is the same region where the service is running (not C). The response is about 4kb, it's not too big (not A).
As a rule of thumb, 4kb is one request. More than 16kb and we get in multiple requests territory. It depends if the request is strongly consistent, eventually consistent, or part of a transaction. Finally, the maximum size of an item is 400kb. All the specific details of these values are in the Developer's Guide.
Strictly speaking, DynamoDB making more than one request doesn't necessarily mean it will be slow for our service. These requests happen in parallel on DynamoDB's backend, which is close to the data and the backend is remarkably optimized. But smaller items are always faster than big items.
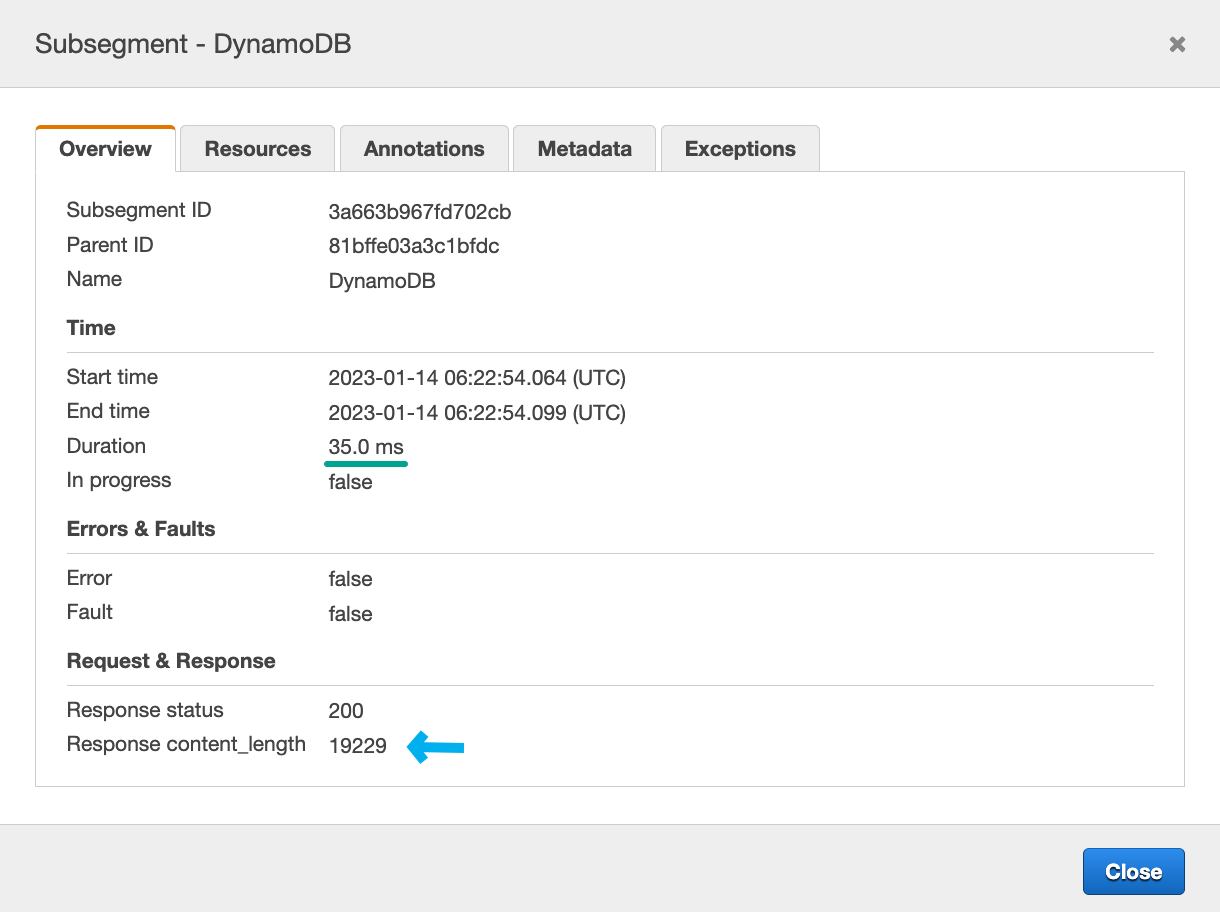
Here's an example of a segment with more data that's still very fast:
 DDB Segment Details - Query took 35ms for ~20kb of data
With just a few clicks and very little instrumentation we ruled out 3 out of 4 scenarios.
Cold Starts
In Serverless, Cold Start is the delay that happens when a function is invoked for the first time or after it has been inactive for a while. During a cold start, the lambda function initializes all its dependencies and pools of resources. This translates into higher latency for the first few requests.
The same happens with traditional services, but only when new containers or tasks are launched while the service is bootstrapping. This is common right after a deployment, when the service is scaling up due to a higher load, or after a service crash.
XRay automatically captures when a lambda function is initializing, so the trace would show if it was a cold start. There's no way for XRay to capture "cold start" in traditional services, but the logs show when the service is bootstrapping. If the latency matches the timeline, and goes away after the first few request then it was a cold start.
Unfortunately, the example above is a full-blown NodeJS service. To debug further, we need to instrument the code and see where the client is being instantiated to see if it's creating a new client for each request.
Request-level Tracking
Digging deeper requires we instrument the client to get the details of the actual operation behind the scenes. Request-level tacking is a lot more useful in real-life distributed services, where things get more complicated and are easier to miss.
If you read this far, I'm sorry, I'm about to ruin the surprise. The scenario I'm using for all these examples is extremely simple. Skimming through the code it should be obvious that this is a text-book cold start (D). A script that runs once when it's executed, there's no time for the SDK to create a pool of connections. The HTTP Client needs to make a full handshake, connection, and SSL validation just to get the data, and then the process ends. But please, continue reading these are one of the most useful and advanced techniques to debug issues with DynamoDB.
Working with TypeScript
All AWS SDK clients are just Http Clients making requests to specific endpoints for each service. The Javascript SDK supports Middlewares and Plugins to customize its behavior and track request-level information.
Using these middlewares makes it easy to capture each request and see what's the exact query that's running and the metadata from the response.
const ddb = XRay.captureAWSv3Client(
    new DynamoDBClient({
        region: process.env.AWS_REGION || 'us-west-2'
    }),
    segment
);

ddb.middlewareStack.add(getRequestMetadata, {
    step: 'build',
    name: 'debug-request'
});

ddb.middlewareStack.addRelativeTo(getResponseMetadata, {
    name: 'response-size',
    relation: 'before',
    toMiddleware: 'XRaySDKInstrumentation'
});export const getRequestMetadata = (next, context) => async (args) => {
const { clientName, commandName } = context;
const { input } = args;
log.debug(`${clientName} - operation: ${commandName}`);
log.debug(input, 'input');
return next(args);
};export const getResponseMetadata = (next) => async (args) => {
const start = process.hrtime.bigint();
return next(args).then((result) => {
const end = process.hrtime.bigint();
log.debug(`Request finished in ${duration(end - start)}.`);
// request status
if (result?.response?.statusCode) {
log.debug(`Status: ${result.response.statusCode}`);
}
// size
if (result?.response?.body?.headers) {
const s = result.response.body.headers['content-length'];
const size = prettyBytes(parseInt(s) || 0);
log.debug(`Response size: ${size}`);
}
// return response unchanged.
return result;
});
};They are very similar to middleware for Express or Middy. You can intercept the request before it's built, when it's serialized, after is built, when it's ready to be sent, and after it's back.
The step option is represents one of the stages of the request. It's used when registering via client.middlewareStack.add so the Http Client knows where to inject the middleware.
getRequestMetadata captures the operation (GetItem, PutItem, Query, etc.) and the parameters (GetItemCommand, PutItemCommand, QueryCommand, etc.).
Here's what the output looks like for fetching an item via its composite key:
[00:35:43.096] DEBUG (ddb-utils): DynamoDBClient - operation: GetItemCommand
[00:35:43.096] DEBUG (ddb-utils): input
    ReturnConsumedCapacity: "TOTAL"
    Key: {
      "key": {
        "S": "run_000000CX655IVKQZFXUOTb2Fr44VU"
      },
      "type": {
        "S": "NUDGE"
      }
    }
    TableName: "game_activities"
getResponseMetadata captures the time it takes to make the request, the status and the size of the response.
This is the output for the same request:
[00:35:43.272] DEBUG (ddb-utils): Request finished in 176 milliseconds.
[00:35:43.272] DEBUG (ddb-utils): Status: 200
[00:35:43.273] DEBUG (ddb-utils): Response size: 3.05 kB
Here's the source, and here is how it's instrumented. Now we have the run time, status, size of the response and the full query. Running the same input in the DDB console should give you a very good estimate of what it should take on average for this type of request. Compare latency, number of results, and the number of pages shown in the console.
Just to demo, here is the performance after running the same query twice:
[00:54:20.517] DEBUG (ddb-utils): Request finished in 276 milliseconds.
[00:48:27.438] DEBUG (ddb-utils): Status: 200
[00:48:27.438] DEBUG (ddb-utils): Response size: 3.05 kB
...
[00:54:20.546] DEBUG (ddb-utils): Request finished in 27 milliseconds.
[00:54:20.546] DEBUG (ddb-utils): Status: 200
[00:54:20.546] DEBUG (ddb-utils): Response size: 3.05 kB
Now we are talking. It takes 27 milliseconds that's the beauty of DDB right there, it's just blazing fast.
Just for completeness, This is a series of paginated Query returning a lot more data:
[01:00:38.000] DEBUG (ddb-utils): Request finished in 176 milliseconds.
[01:00:38.000] DEBUG (ddb-utils): Status: 200
[01:00:38.000] DEBUG (ddb-utils): Response size: 19.2 kB
[01:00:38.001] INFO (Queue Nudging): Got page 1 with 25 items.
...
[01:00:41.218] DEBUG (ddb-utils): Request finished in 31 milliseconds.
[01:00:41.218] DEBUG (ddb-utils): Status: 200
[01:00:41.218] DEBUG (ddb-utils): Response size: 19.2 kB
[01:00:41.218] INFO (Queue Nudging): Got page 100 with 25 items.
...
[01:00:41.247] DEBUG (ddb-utils): Request finished in 28 milliseconds.
[01:00:41.247] DEBUG (ddb-utils): Status: 200
[01:00:41.247] DEBUG (ddb-utils): Response size: 19.2 kB
[01:00:41.247] INFO (Queue Nudging): Got page 101 with 25 items.
After making the first request, all following requests made with the same client show the latency expected from DDB.
Working with Java
Java has two different versions of the AWS SDK. They do things slightly differently, whenever possible use v2 (specially if you're thinking of going with Lambda).
Generally speaking, v2 is leaner and is split into different clients. Whereas v1 is bundled together, and has specialized clients for a few things that are not yet available on v2 (like the DDB Lock Client).
AWS SDK v1
AWS SDK v1 support intercepting requests via RequestHandler2
Join the Conversation via Github and Giscus