Scaling Doc Processing with Serverless
Intro to Document Processing
Standard Metrics' mission is to accelerate innovation in the private markets. We're building a platform that aims to become a financial "lingua franca" between startups and venture firms.
We help startups share financial metrics with their investors effortlessly. One of our core services is analyzing, validating, and capturing metrics from Financial Documents that startups share with their investors.
Our Data Solutions team is in charge of this process. They offer strong SLAs on the time it takes from when a document is uploaded to our platform until it's analyzed and its metrics are available through our platform. It's part of their quarterly OKRs, so they track it religiously and have goals around it.
Efficiency is key, especially when dealing with a high volume of documents and you want to maintain high-quality metric data.
The Problem
Excel files are used ubiquitously for financial data. They represent 60% of all the documents on the platform. It's so crucial that we built a specific tool where the Data Solutions team analyzes, validates, and maps which value belongs to which financial metric.
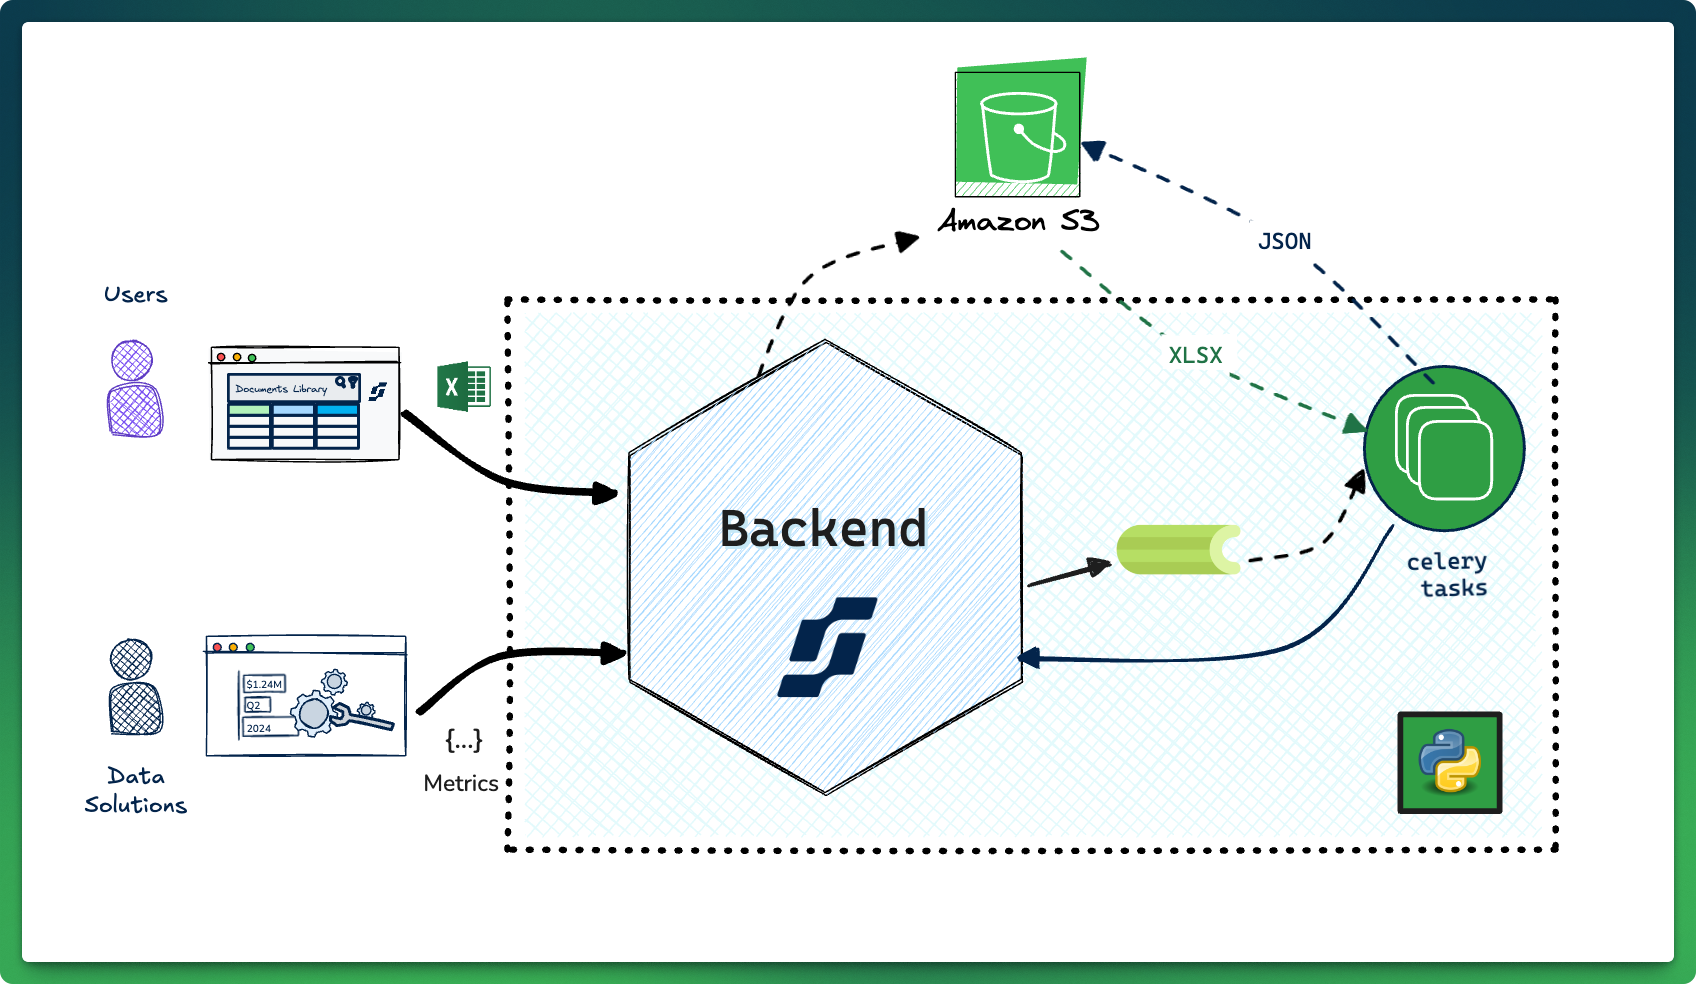
A JSON representation of the Excel file powers the tool's UI. Documents uploaded to our platform are stored and scanned for virus in S3. Later, a Celery task within our Kubernetes cluster transforms the document into its JSON representation, and uploads it back to S3 for the UI to consume.
The original implementation of the Document Processing queue had several issues. Processing failures would get stuck in the queue causing bottlenecks, and a real lack of visibility into what was going wrong forced us to be reactive putting out fires as they popped up.
Investigating these issues was a time sink for engineering and negatively impacted the Solution team’s SLAs and OKRs.
Step Zero
Understanding the problem with instrumentation
The initial theory was that Calamine, the library we used to read the Excel files, was consuming too much memory for big files or files with images and getting killed by the Kubernetes controller, blocking other tasks in the same Pod and the tasks behind it as when it was rescheduled.
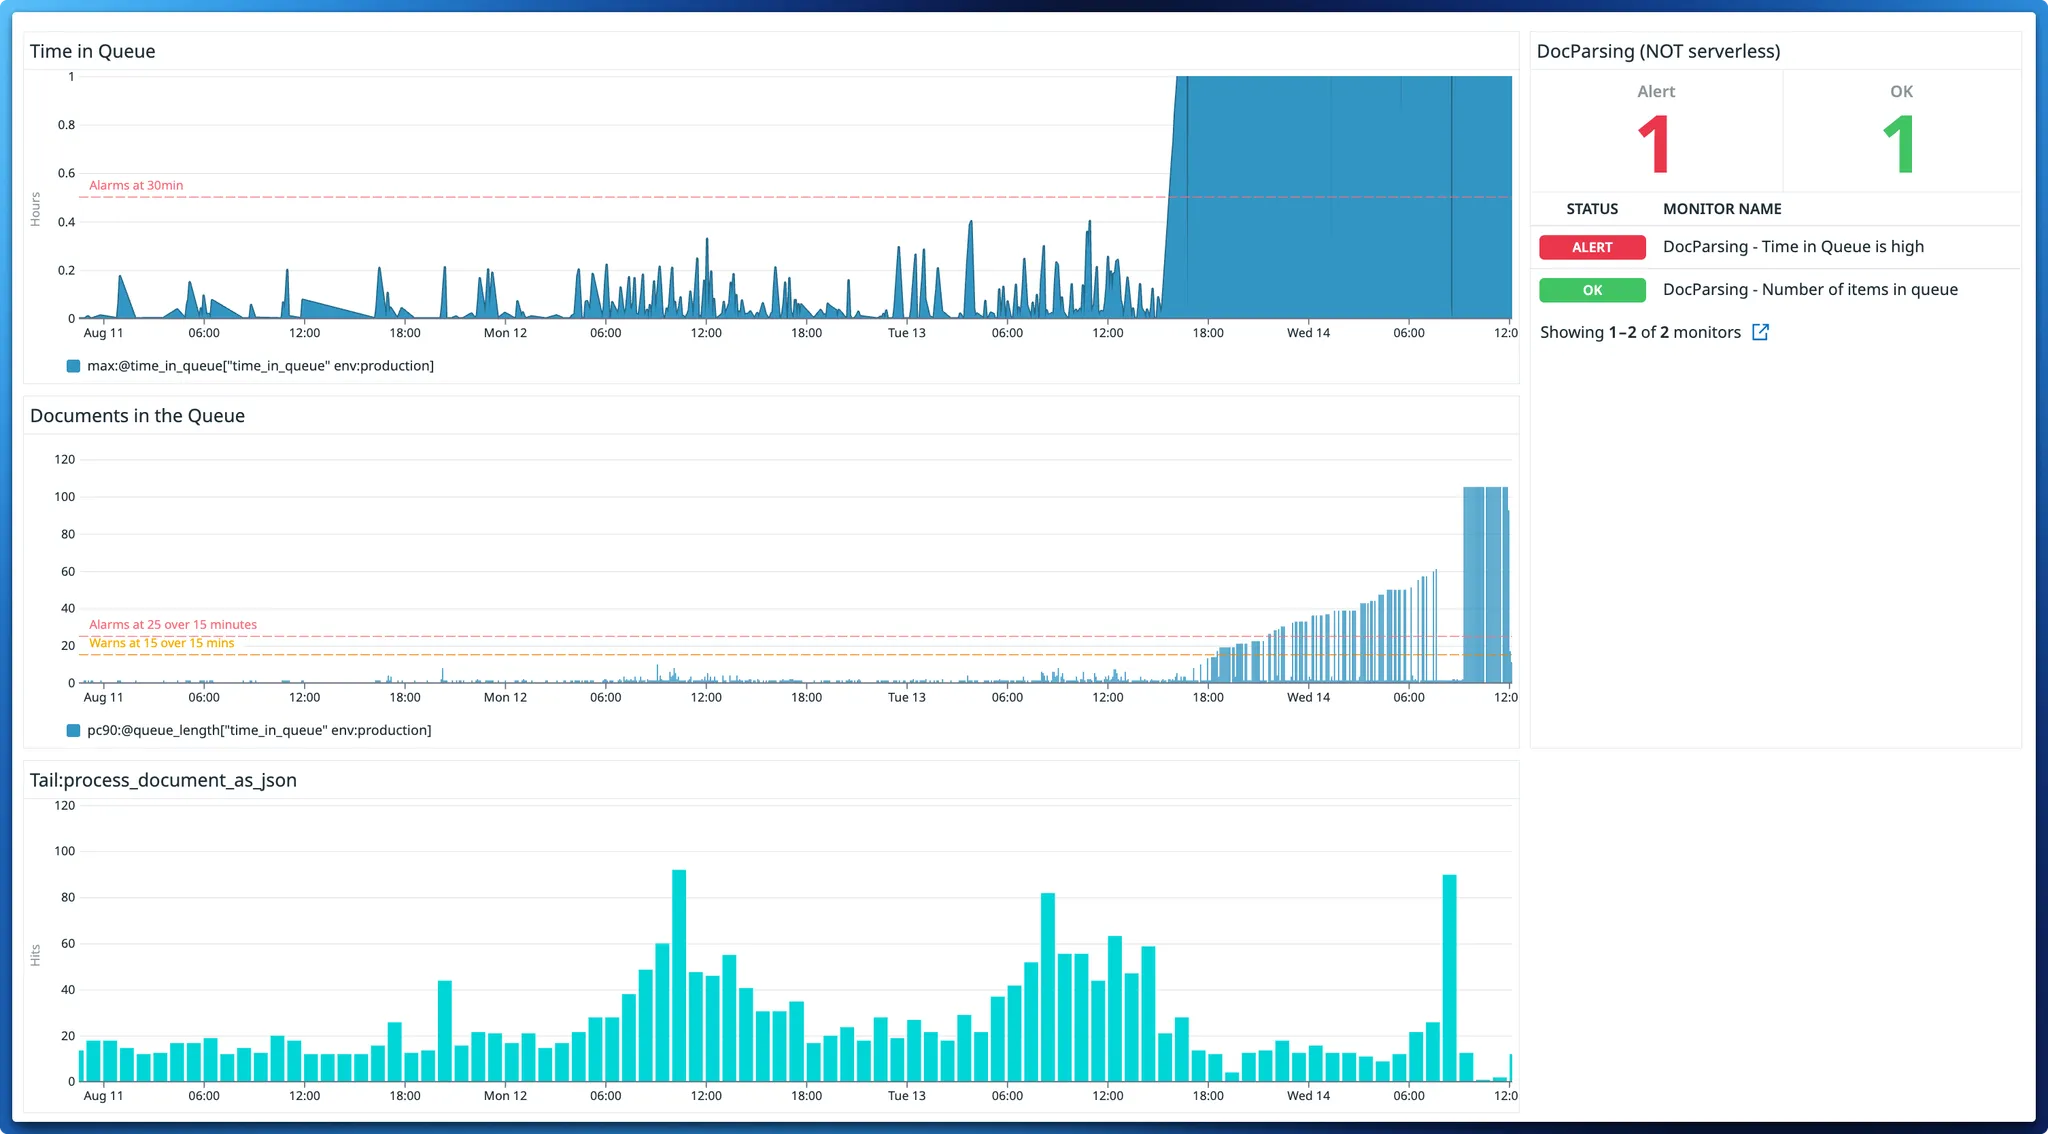
Our highest priority was instrumenting the celery task to see into the failures. You can't fix what you don't understand. We improved logs and metrics on the task to track "Time in Queue" and the number of "Items in the Queue."
We added two alarms:
- When the time in queue exceeded 30 minutes.
- When there were more than 25 files in the queue for more than 15 minutes.
The turning point
Things improved significantly. Instead of finding issues days later, engineers got alerts within hours. On the flip side, this alarm was triggering as often as three times per week. It was a step on the right direction, but things still needed to be better for the Solution team’s SLAs.
We also noticed a new pattern: During reporting season (when Startups share more data with their investors) time in queue went up, taking up to 20 minutes for individual tasks to run.
With all this new information, and knowing this was happening more often than initially thought, we carved out space in our roadmap to find a solution.
Doc Processing v2
With a better understanding of how things needed to work, the team proposed a new architecture for Doc Processing where queueing and JSON generation would happen outside our core backend using AWS Lambda and SQS instead of running inside our Kubernetes cluster running in Celery tasks.
Our goals for the project were:
- Better Isolation. Processing would not affect any other tasks in the platform. And when a task fails, it is retried automatically. It shouldn’t block other operations.
- Build with good bones. Good instrumentation makes understanding problems easier. We have better guard rails against failures with strong retry guarantees from the infra and the ability to “replay” failures. When there's any issues we understand why they happen, and we make sure they won't happen again in the future.
- Dogfooding and integrating with the core service. The plan was to leverage our existing backend codebase as much as possible.
High-level implementation
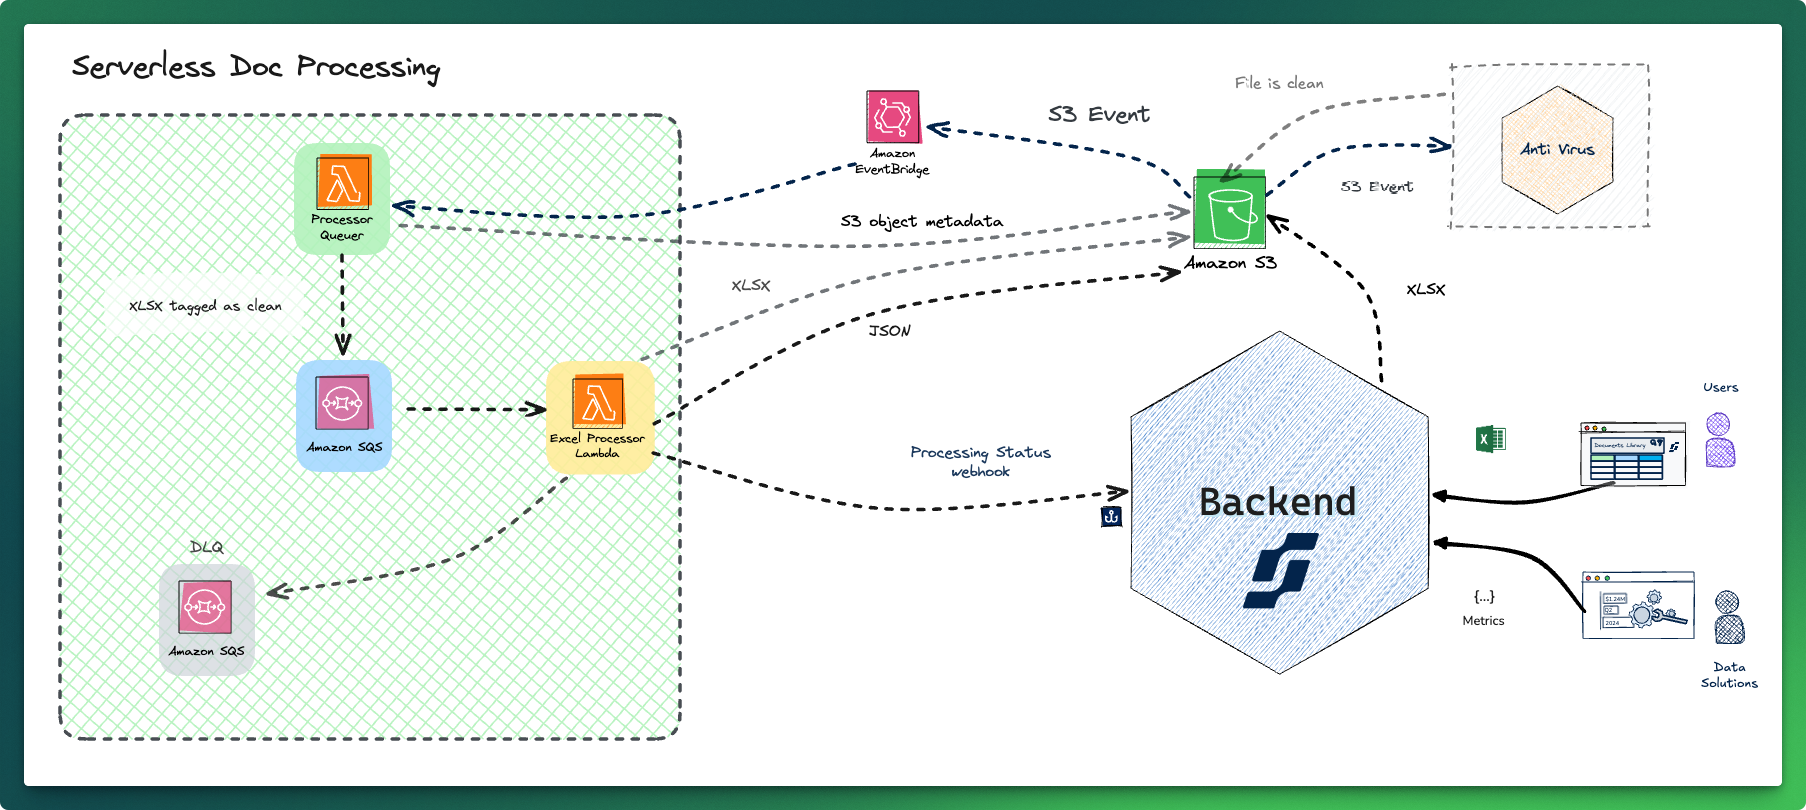
We made the strategic decision of going with serverless, swapping out the Celery tasks for NodeJS lambda processors, integrating directly with events from S3 via EventBridge.
A Lambda function picks up the documents when they are marked as clean by the antivirus, and queues them for processing. When the documents are processed their JSON representation is uploaded back to S3, and there’s a notification via a webhook to our core backend with the status. Because of the SQS integration, all files are automatically retried three times in case of failures, and they’re sent to a Dead-letter queue (DLQ) when they’re unprocessable.
We limit the volume of requests to the backend with Lambda’s reserved concurrency settings. Any spikes are processed slowly, minimizing contention for resources with other tasks running in the backend.
Like a coffee shop limiting the number of V60 orders it takes at rush hour to maintain quality, Lambda’s reserved concurrency prevents a flood of requests from overwhelming our backend.
This ensures every document gets processed efficiently, just like every customer gets their perfect cup of coffee, even during the busiest periods.
Observability and Metrics
Observability is a first-class citizen this time around. We use DataDog to trace the process end to end. Logs from all our lambda functions and the backend are centralized in DataDog, too, making it much simpler to find the root cause of any issue.
We implemented alarms for Processing time, Queue length, and Documents in the DLQ. We can trace by document name, document id, request id or execution id and see the flow from when a file is uploaded, when it’s queued, picked up for processing, all the way to the webhook in the backend.
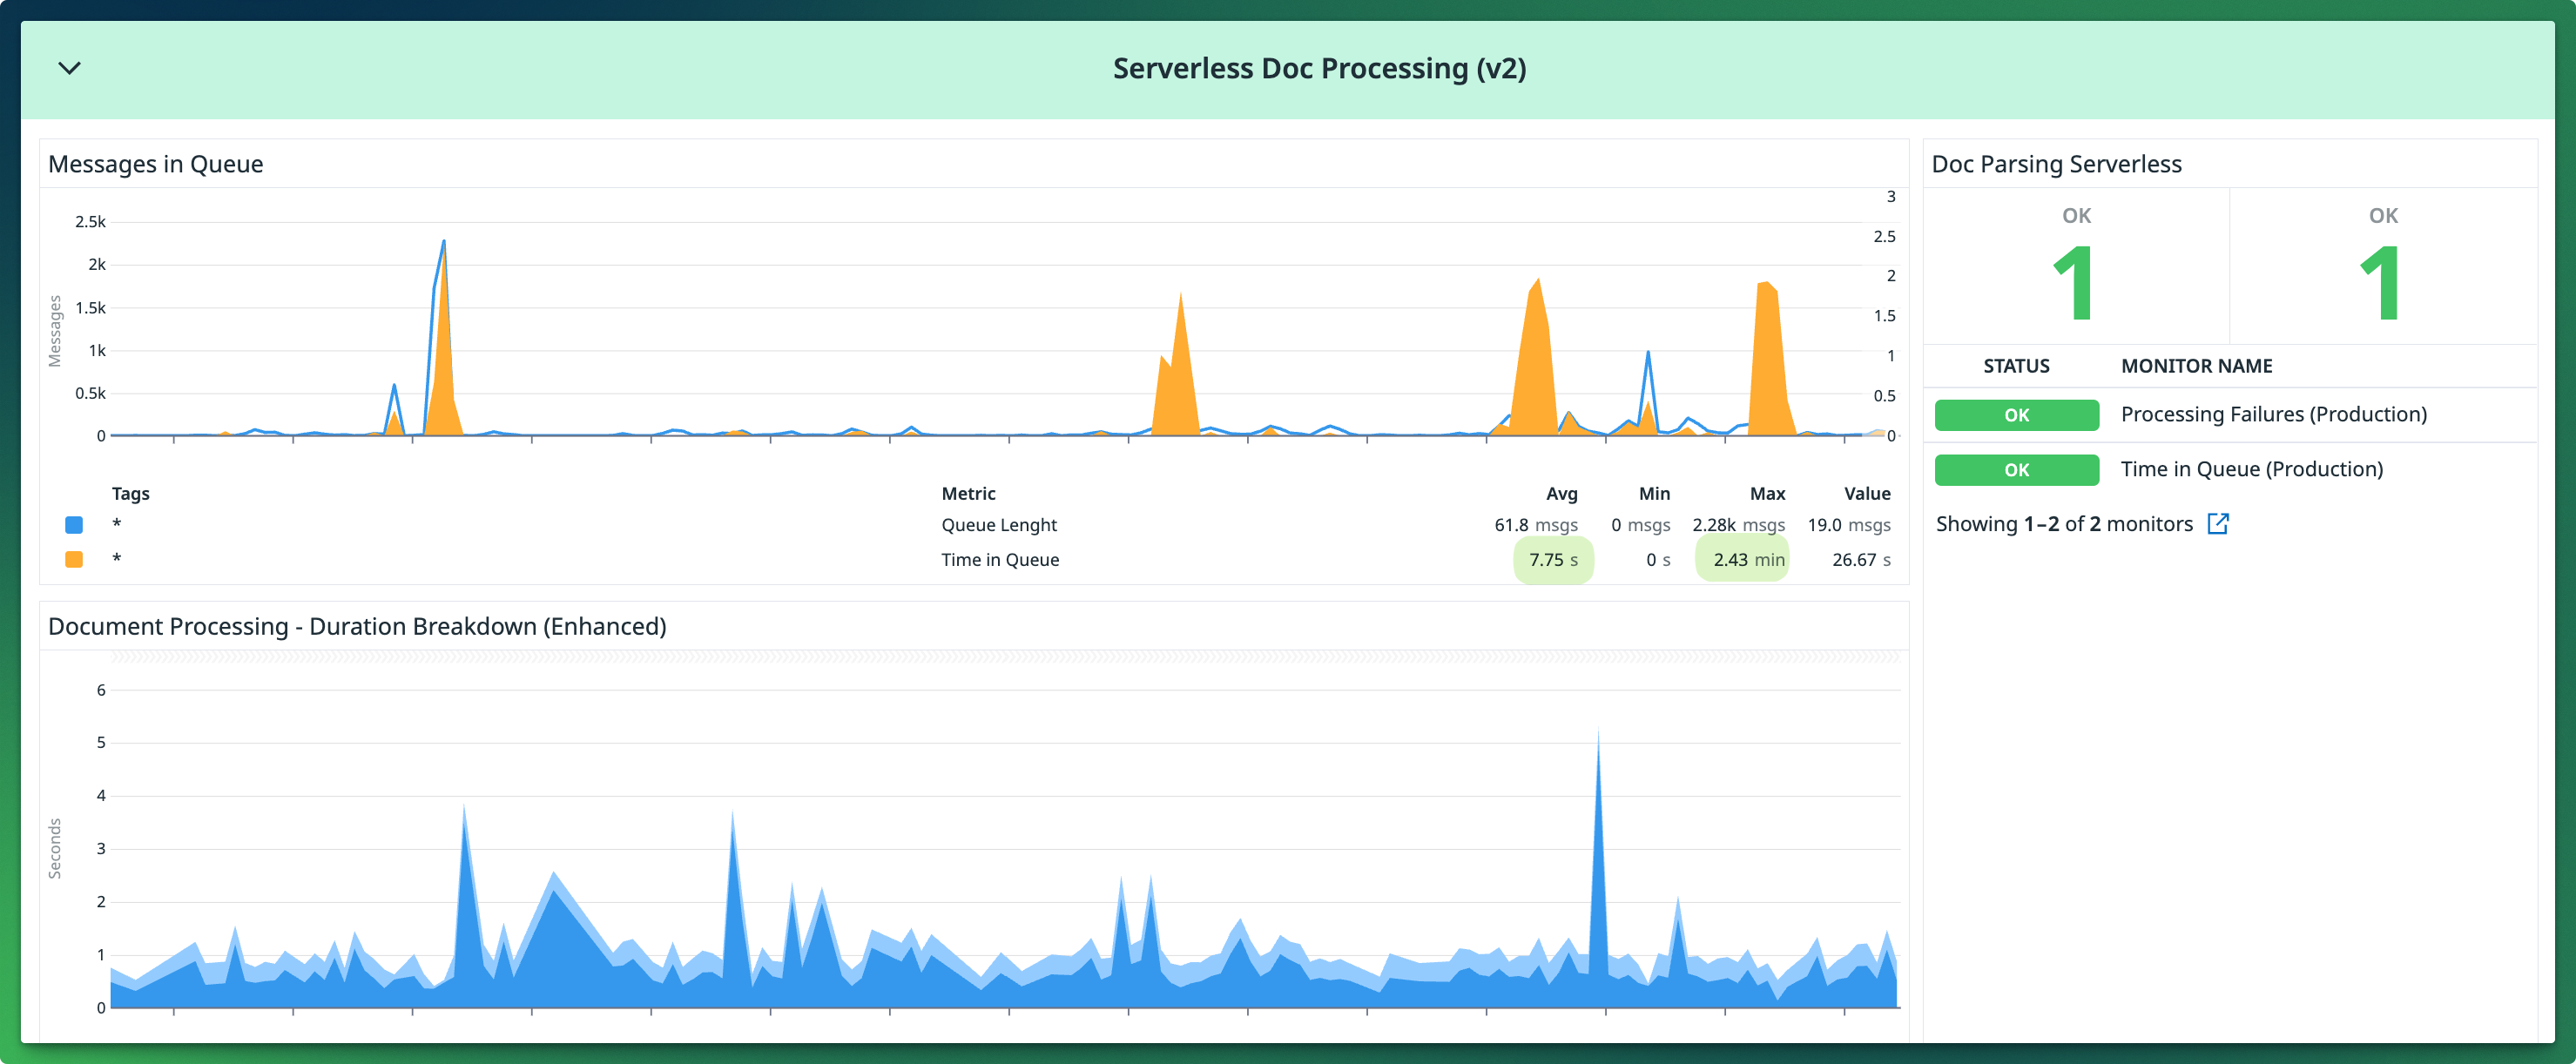
Processing files is much faster. Our average processing time is now 8 seconds, down from 20 minutes. The maximum time processing went down to 3 minutes, down from 4 days. Because of that, we also alarm much earlier now; we alarm when a document it's been queued for 10 minutes (down from 30 minutes) or when there are files in the DLQ.
Scaling with spikes
In our previous implementation, heavier traffic was a major pain point. It usually meant the queue slowed to down to a crawl. When tasks spiked 3x to 4x our regular traffic, resource contention started bleeding into other endpoints and celery tasks.
We handle spikier loads gracefully now. Our most recent spike was 35x our average traffic. It was very noticeable on the dashboards compared with our average weekly traffic; however, its impact was negligible.
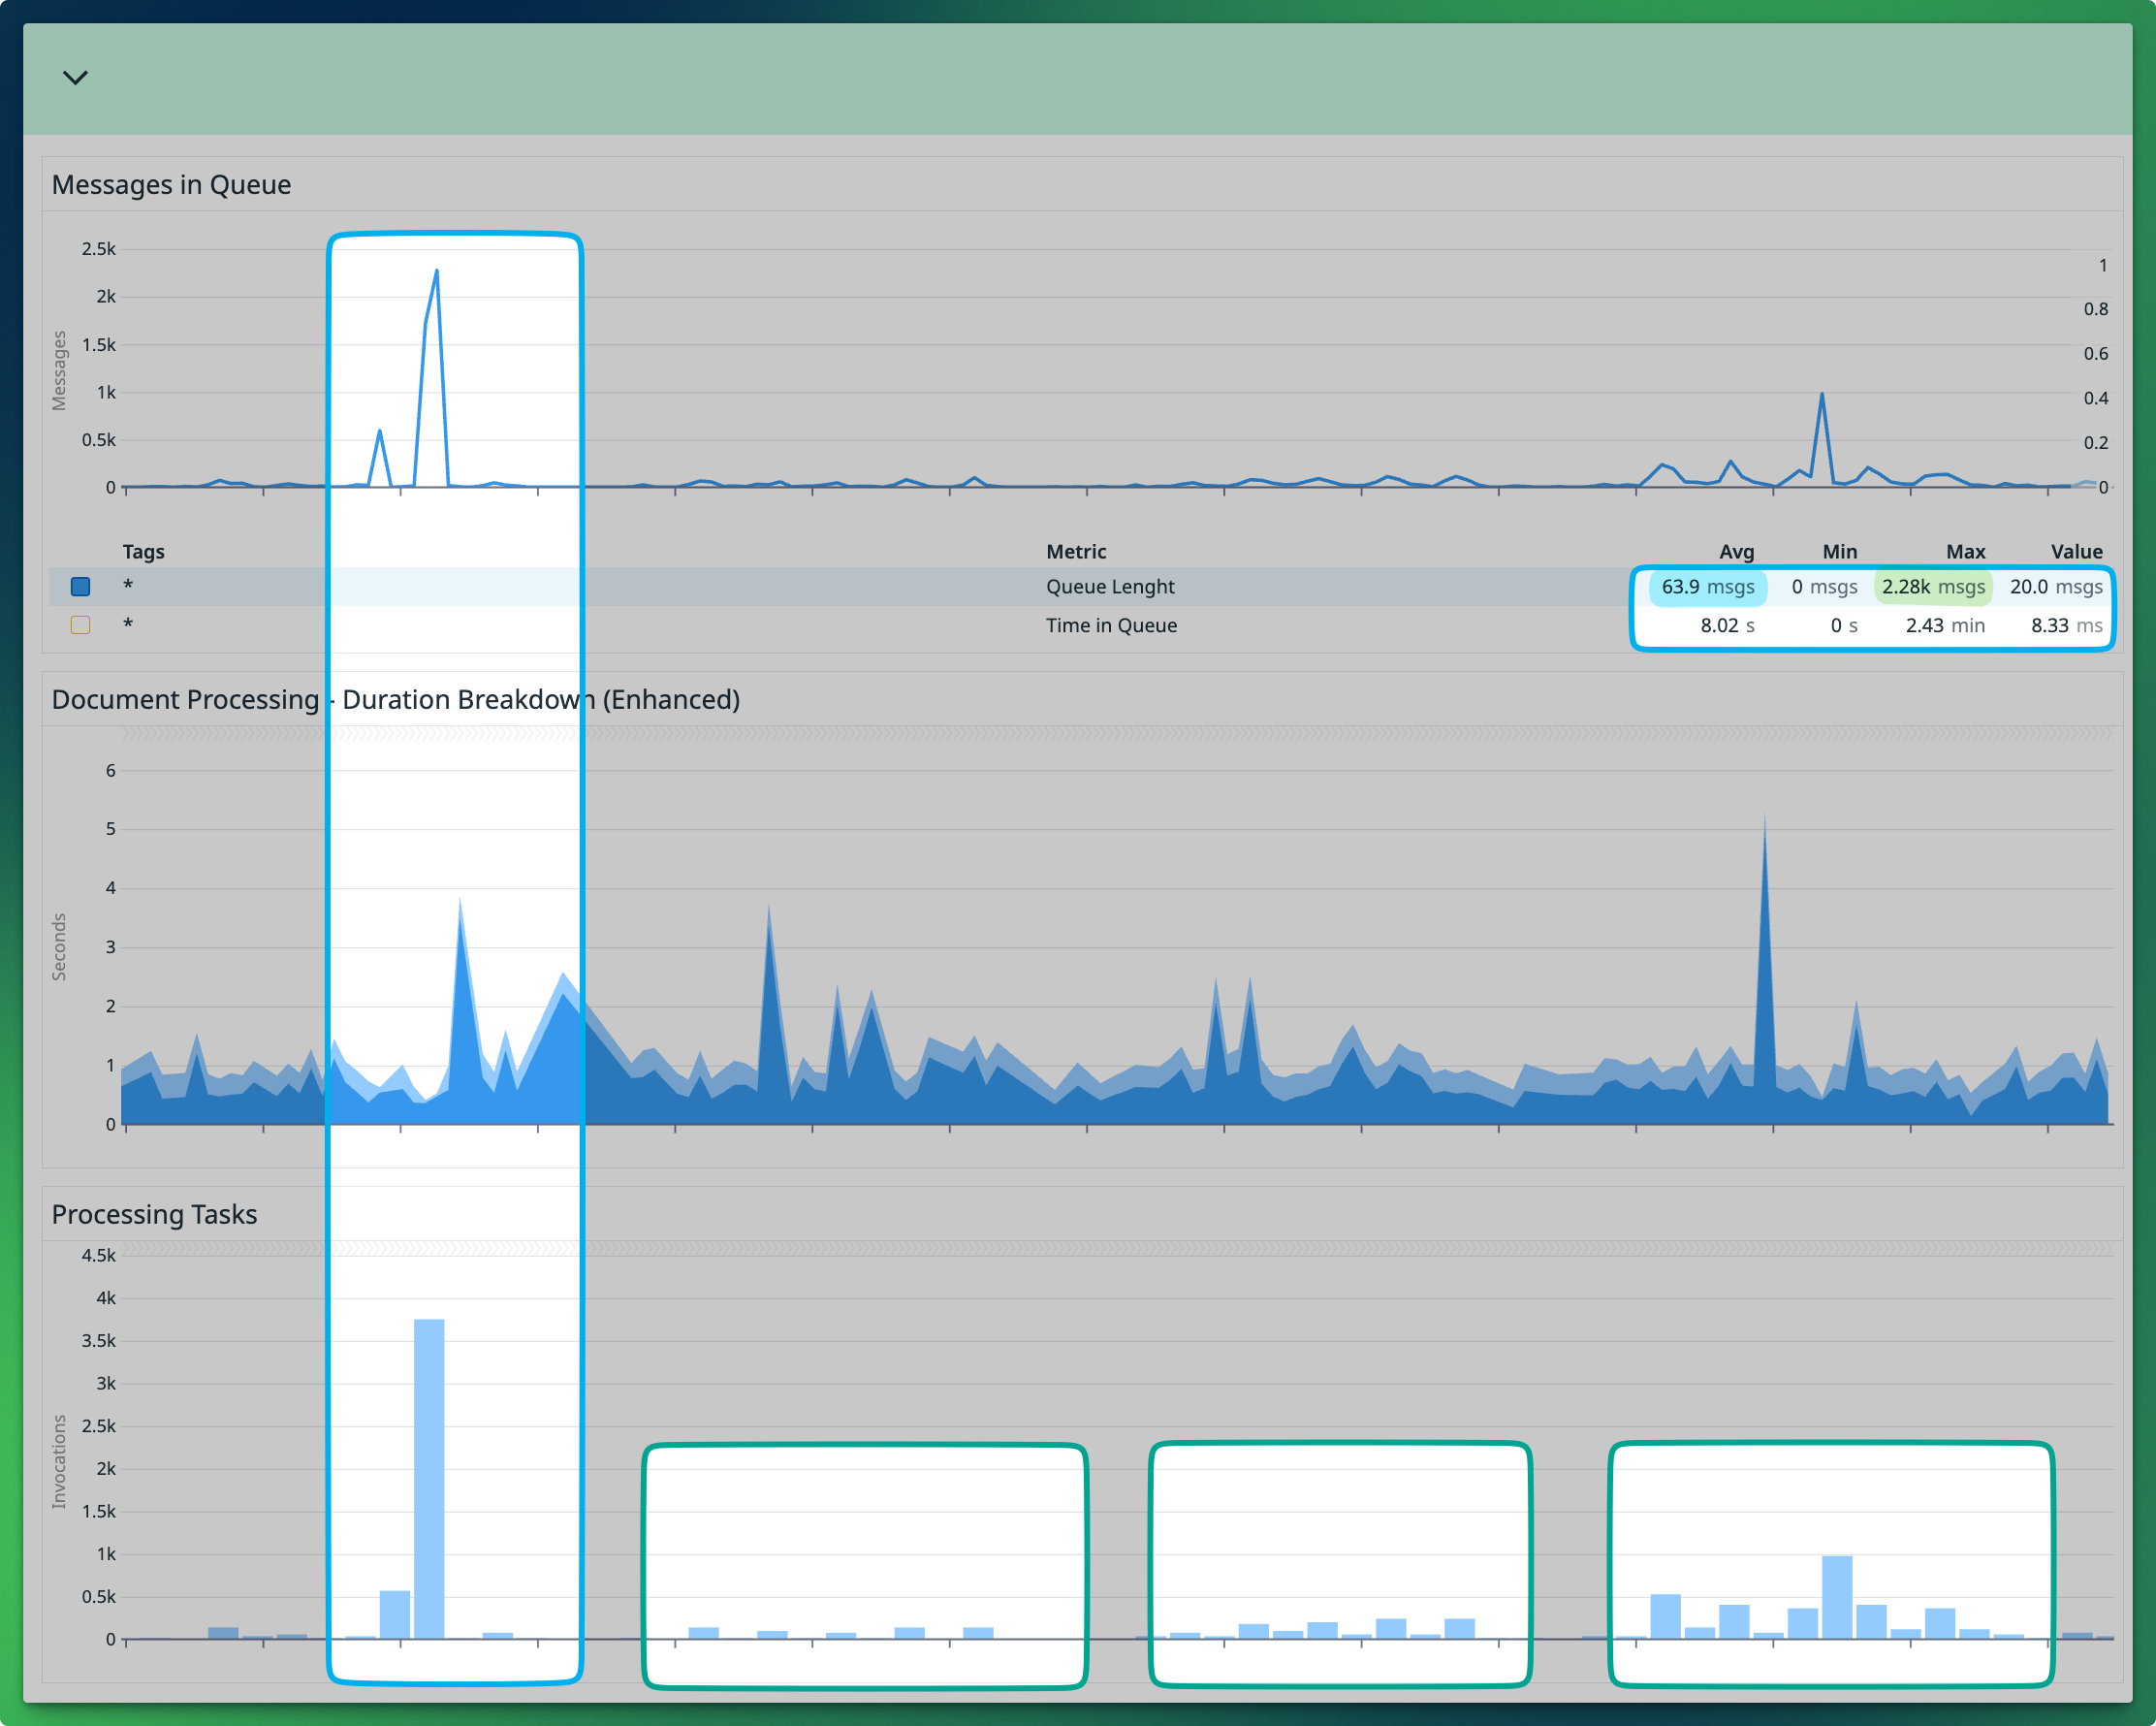
We processed the spike with a 100% success rate. Maximum time in queue went up to 2.43min as the new system “buffered” files in the queue for processing. But remarkably, time processing per document (each task’s execution) stayed well under the 8s average.
With higher traffic, our Lambda functions stay warm with established connections and cached dependencies — much like pulling shots on a dialed-in, warmed-up espresso machine after its first pour of the day.
Learning Lessons
This project was a success; we learned a lot while building it. We ran the two versions side to side for a week and identified all failure modes in processing that were hidden before. We migrated all traffic in about three weeks, including a few extra features — no major issues.
Our big wins were:
- We reduced the time in queue and improved the experience of the solutions team with extra features and a better integration with the antivirus workflow.
- We improved error handling, processing speed, traffic spikes handling, and instrumentation, improved our time to recovery, and made our runbooks a lot simpler.
Some trade-offs:
- This project adds extra complexity as we are adding more infrastructure and a new pattern with serverless. All engineers will need time to understand and work with this new stack. Testing locally is also more difficult.
- We had to choose between TypeScript and Python for Lambda. We went with TypeScript because Lambda makes it much easier to work with Node (both infra and logic use the same codebase).
Overall, we are very happy with this new implementation. It was a win for both DS and Engineering teams not having to think about “the queue” anymore.
For the DS team specifically it was a huge quality of life improvement, they now focus on the part of their day to day that matters (and not how that is implemented). They also had a huge win on their SLAs last quarter!
It’s nice to think the engineering team help them achieve it.
Thanks for reading! Now, coffee time. An AeroPress seemed like a good fit for this post, enjoy!
Coffee Time: Lance Hendrick's AeroPress recipe
Brew time: 3min
Ratio: 1:16 - 15g for 240ml (1 cup)
Steps
- Add 15-18 grams of ground coffee to the AeroPress, and level the coffee
- Pour about 30 grams of hot water (82 - 92°C) for blooming
- Swirl in a circular motion making sure the water and coffee are evenly mixed together
- Let it rest for 45s
- Complete the second pour the rest of the water slowly
- Put the plunger to stop the drops, and give it a little swirl
- Let it sit again until the 2 minutes mark
- Push the plunger slowly and steadily just with the weight of your hand, it should take about a minute
A delicious cup of coffee pushed via a pipe! ☕️